Soil Management Guide
Water Use and Moisture Management
- Soil moisture definitions for plant growth
- Soil moisture definitions for other purposes
- Reporting soil moisture
- Water movement through soil
- Basic water movement principles and rules of thumb
- How far will an inch (25 millimetres) of water move into a soil profile?
- Water management strategies
In addition to supporting our agricultural needs, we rely on the soil to regulate the flow of rainwater and to act as a filter for drinking water. With such a tremendously important role, it is imperative that we manage our soils for their long-term productivity, sustainability and health. Soil data on available water holding capacity, permeability (the rate at which water moves through a soil), depth to groundwater, flooding, slope gradient and depth to bedrock can be useful in determining the risk of groundwater contamination due to leaching or surface water contamination due to runoff and erosion.
Soil moisture definitions for plant growth
- Saturation is the moisture content at which all soil pores are completely water-filled.
- Field capacity (FC) is the maximum amount of water held in a soil, measured a few days after it has been thoroughly soaked and allowed to drain freely. (Note: FC is difficult to determine for heavy clay soils because water drains so slowly through these soils.)
- Permanent wilting point (PWP) is the soil water content at which water is no longer available to plants, which causes them to wilt because they cannot extract enough water to meet their requirements.
- Available water (AW) is the amount of water held in a soil that plants can use. The maximum amount of available water held in a soil is the difference between the PWP and FC, expressed in inches or millimetres of water per unit depth of soil.
- Air Dry is the amount of water remaining in soil after drying at room temperature for several hours. Only water that is tightly held to the soil particles (hygroscopic water) remains.
Table 3.1 Moisture contents (by weight) for selected soil types and depths
| Gas Tank Analogy: | Soil Moisture Content (%) | ||||||
| Stockton (FS) | Newdale (CL) | Red River (HC) | |||||
| 0-6" (0-15 cm) | 0-30" (0-76 cm) | 0-6" | 0-30" | 0-6" | 0-30" | ||
| Saturation* | Tank is overflowing | 37 | 31 | 42 | 36 | 56 | 50 |
| Field Capacity | Tank is full | 15 | 14 | 29 | 27 | 45 | 43 |
| Permanent Wilting Point | Tank is empty | 4 | 4 | 12 | 9 | 18 | 18 |
| Available Water | Size of the tank | 11 | 10 | 17 | 18 | 27 | 25 |
| Air Dry | N/A | 1-2 | 1-2 | 2-3 | 2-3 | 3-4 | 3-4 |
*Saturation is the moisture content when lack of oxygen will adversely affect plant growth and may induce denitrification. Note that saturation (on a weight basis) occurs well below 100% and even below 50% on most soils. Plants cannot extract all the available water between field capacity and permanent wilting point with equal ease. Soil water is more readily available to plants when soils are near field capacity and less so as soil moisture content approaches the permanent wilting point.
Table 3.2 Determining available soil moisture by feel or appearance
| % Available water remaining | Coarse (VCoS - LFS) | Light (VFS - FSL) | Medium (L - SiCL) | Heavy (SC - HC) |
| 0 (PWP or drier) | Dry, loose, single grained, flows through fingers | Dry, loose, flows through fingers | Powdery, dry, sometimes slightly crusted but easily breaks down into powdery condition | Hard, baked, cracked, sometimes has loose crumbs on surface |
| < 50 | Still appears to be dry; will not form a ball with pressure | Sill appears to be dry; will not form a ball | Somewhat crumbly but will hold together from pressure | Somewhat pliable, will ball under pressure |
| 50-75 | Still appears to be dry; will not form a ball with pressure | Tends to ball under pressure but seldom will hold together | Forms a ball, somewhat plastic, will sometimes slick slightly with pressure | Forms a ball, will ribbon out between thumb and forefinger |
| 75 to FC | Tends to stick together slightly, sometimes forms a very weak ball under pressure | Forms weak ball, breaks easily, will not slick | Forms a ball and is very pliable, slicks readily if relatively high in clay | Easily ribbons out between fingers; has a slick feeling |
| At FC | Upon squeezing, no free water appears on soil but wet outline of ball is left on hand | Upon squeezing, no free water appears on soil but wet outline of ball is left on hand | Upon squeezing, no free water appears on soil but wet outline of ball is left on hand | Upon squeezing, no free water appears on soil but wet outline of ball is left on hand |
| Above FC | Free water appears when soil is bounced in hand | Free water will be released with kneading | Can squeeze out free water | Puddles and free water forms on surface |
Soil moisture definitions for other purposes
- Liquid Limit is the moisture content at which a soil begins to flow and behave like a liquid.
- Plastic Limit is the moisture content at which a soil sample changes from a semi-solid to a plastic state (This is the point at which travel on the soil becomes difficult, if not impossible).
- Oven Dry occurs when soil has been dried at 105°C for 24 hours so that no water remains. Oven drying of soil is done to determine the total amount of water present in a soil prior to oven drying for moisture content determination.
Table 3.3 Moisture contents (by weight) for selected soil types and depths
| Gas Tank Analogy: | Soil Moisture Content (%) | ||||||
| Stockton (FS) | Newdale (CL) | Red River (HC) | |||||
| 0-6" (0-15 cm) | 0-30" (0-76 cm) | 0-6" | 0-30" | 0-6" | 0-30" | ||
| Liquid Limit | N/A | N/A | N/A | 46 | 42 | 65 | 68 |
| Plastic Limit | Tank is ~ 1/2 full | N/A | N/A | 26 | 22 | 25 | 27 |
| Oven Dry | Tank is empty (no fumes) | 0 | 0 | 0 | 0 | 0 | 0 |
Reporting soil moisture
| Soil moisture content can be expressed on either a weight basis (gravimetric) or on a volume basis (volumetric). Gravimetric soil moisture (W%) = | 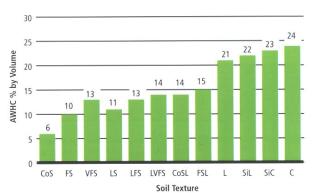 Figure 3.1 Relationship between soil texture and available water holding capacity (AWHC) |
wt. (wet soil) – wt. (oven dry soil) x 100% wt. (oven dry soil) | |
Volumetric soil moisture (θ%) = | |
gravimetric soil moisture x bulk density | |
| It is important to measure soil moisture content when monitoring soil nutrient changes over time. Available Water Holding Capacity (AWHC) describes how much available water a fixed amount of soil can hold for plant uptake. It is largely determined by soil texture and to a limited degree by soil structure and organic matter content. |
Water movement through soil
Infiltration is the entry of water into soil. The rate of infiltration can be relatively fast, especially as water enters into pores and cracks of dry soil. As the soil wets up and becomes saturated, the infiltration rate slows to the point where water ponding and runoff may occur. Hydraulic conductivity is the rate at which water can pass through a soil material, usually measured under saturated conditions (i.e. when a small volume of soil has been sufficiently saturated) to ensure water is moving through the soil via gravity and positive head pressure. Saturated hydraulic conductivity (Ksat) provides the simplest and most consistent means of measuring the rate of water movement through soils. The rate of water movement through a given soil is largely determined by the texture. Large soil particles (sands) create large pore spaces between the particles, allowing water to move through these pores relatively quickly and with little adhesion to soil particles. Small soil particles (clays) pack together more tightly, producing numerous small pore spaces that represent a larger volume than the pore volume of sandy soils, but allow the transmission of water at a much slower rate. Movement of water through clay soils is restricted by the small pore size and the significant adhesive forces between water and soil particles. Other factors affecting water movement through soil are the internal drainage, depth to water table, soil structure, amount of organic matter present and the presence of soluble salts (salinity).
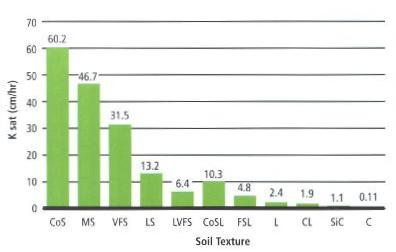
Figure 3.2 Relationship between hydraulic conductivity and soil texture
Basic water movement principles and rules of thumb
- Water flows more quickly through large pores (sandy soils) than small pores (clay soils); water is held more tightly in small pores (clay soils) than in large pores (sandy soils).
- Water moves from wet areas to dry areas (not necessarily by gravity) due to forces of adhesion and cohesion. This is called matric flow.
- Water will not move from small soil pores to large soil pores unless conditions are saturated. This phenomenon explains why coarser layers in the soil subsurface, or cracks or root channels that have been cut off from the soil surface by tillage, actually restrict the downward movement of water until the moisture content of the surrounding area becomes saturated (i.e. the “check valve” phenomenon).
How far will an inch (25 millimetres) of water move into a soil profile?
Several concepts need to be discussed to understand how to calculate the depth of water infiltration. Soil porosity is the percentage of a given volume of soil that is made up of pore spaces. Soils are oven-dried to measure bulk density, so porosity is a measure of air-filled pore space. Bulk density is the apparent density of a soil, measured by determining the oven-dry mass of soil per unit volume. The volume of soil is determined using sampling cores and is measured before soil is oven-dried to avoid any changes in volume due to drying. Bulk density is usually expressed in g/cm3 or Mg/m3.
Table 3.4 Typical bulk densities for various soil series
| Soil Series | Bulk Density (g/cm3) 0-6" depth (0-15 cm) |
| Stockton fine sand | 1.34 |
| Newdale clay loam | 1.26 |
| Red River heavy clay | 1.07 |
| Most rocks | 2.65 |
| Compacted soil | 1.80 |
Particle density is the grain density, or the mass per unit volume of the soil particles. Pore spaces found in bulk soil samples are excluded. Particle density is usually expressed in g/cm3 or Mg/m3, and the particle density for most agricultural soils is 2.65 g/cm3. These three factors are used to calculate the depth an inch (25 millimetres) of precipitation moves into a given soil. The distance an inch (25 millimetres) of water (precipitation) moves into the soil depends on several factors including initial soil moisture content, amount of water lost as runoff, texture, structure, organic matter content and porosity. A general estimate can be calculated for dry soil using the following formulae:
| % Porosity = [1-(bulk density ÷ particle density)] x 100 | |
| where particle density | = 2.65 g/cm3 |
| Depth of water infiltration for dry soil ~ [depth of water ÷ (% porosity/100)] | |
| E.g. 1) A sandy soil with a bulk density of 1.2 g/cm3: | |
| % Porosity | = [1 – (1.2 ÷ 2.65)] x 100 |
| = 55% | |
| Depth of water infiltration ~ [1 inch ÷ (55/100)] = 1 inch ÷ 0.55 = 1.8 inches | |
| Therefore, an inch of precipitation will move 1.8 inches (4.5 centimetres) in a dry sandy soil. | |
| E.g. 2) A clay soil with a bulk density of 0.9: | |
| % Porosity | = [1 – (0.9 ÷ 2.65)] x 100 |
| = 77% | |
| Depth of water infiltration ~ [1 inch ÷ (77/100)] = 1 inch ÷ 0.77 = 1.3 inches | |
| Therefore, an inch of precipitation will move 1.3 inches (3.25 centimetres) in a dry clay soil. | |
Table 3.5 Relative crop suitability on various soil types
| Texture | Coarse (sand) | Medium (loam, clay loam) | Fine (clay) | ||||||
| Drainage | Well | Imp. | Poor | Well | Imp. | Poor | Well | Imp. | Poor |
| Crops: | |||||||||
| Cereals |  |
 |
W |  |
 |
W |  |
W | W |
| Flax, canola | M | M | W |  |
 |
W |  |
 |
W |
| Peas, lentils | M |  |
W |  |
 |
W | W | W | W |
| Field beans |  |
 |
W |  |
W | W | W | W | W |
| Sunflowers |  |
 |
W |  |
 |
W |  |
 |
W |
| Soybeans | M | M | W |  |
 |
 |
 |
 |
W |
| Faba beans | M | M | W |  |
 |
W |  |
 |
W |
| Corn |  |
 |
W |  |
 |
W |  |
W | W |
| Buckwheat |  |
 |
 |
 |
 |
W |  |
W | W |
| Canary seed | M |  |
W |  |
 |
W |  |
 |
W |
| Potatoes |  |
 |
W |  |
 |
W | H | H | W |
| Hybrid popular | M |  |
W |  |
 |
W |  |
W | W |
| Forages: | |||||||||
| Alfalfa | M |  |
W |  |
 |
 |
 |
W | W |
| Drought tolerant grasses* |  |
 |
 |
 |
 |
W |  |
W | W |
| Flood tolerant grasses** | M | M |  |
 |
 |
 |
 |
 |
 |
| Orchardgrass | M | M |  |
 |
 |
 |
 |
W | W |
* = tame species of wheatgrasses, wild rye, etc. ** = reed canarygrass, meadow foxtail, fescues, etc. P= suitable most years M = moisture challenges in normal-dry years; suitable in wet years W = wetness challenges in normal-wet years; suitable in dry years H = harvesting challenges (i.e. potatoes on clay)
- 1 inch (25 millimetres) of precipitation = 22,500 gallons/acre (252,675 litres/hectare) of H20
- actively growing plants transpire approximately 1/3 inch (8.3 millimetres) of water per day (which is 7500 gallons/acre/day or 84,225 litres/hectare/day).
Water management strategies
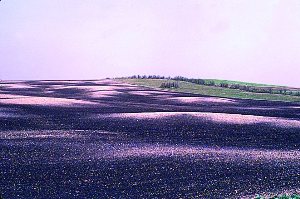
A. Droughty soils (soils with an agriculture capability modifier “M”) require moisture conservation practices, which may include the following:
 |
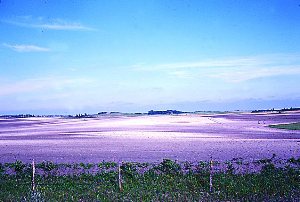 |
| Figures 3.3 and 3.4 Examples of soils with drought limitations | |
- Avoiding summer fallow – summer fallow does a poor job of conserving moisture, reduces soil organic matter, increases soil salinity, and leaves soil prone to erosion (spring moisture conditions in Manitoba are usually adequate for continuous cropping)
- Adopting reduced tillage, leaving more crop residues on the surface to reduce evaporation
- Avoiding unnecessary tillage – each tillage pass removes approximately 1/2" (12.7 millimetres) of water from the soil
- Snow management – leave standing stubble, plant shelterbelts or annual barriers, or leave trap strips of stubble
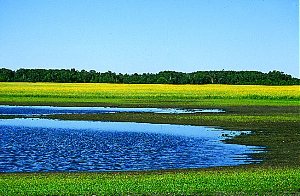
B. Wet soils (soils with an agriculture capability modifier “W”) require moisture removal, which includes the following practices:
 |
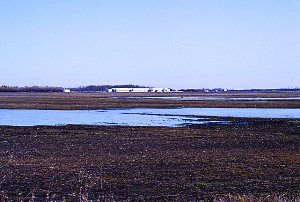 |
| Figures 3.5 and 3.6 Examples of soils with excess water limitations | |
- Drainage – systems should be designed to have sufficient capacity to remove excess water before crop damage occurs
- Tillage – although each tillage pass removes approximately 1/2" (12.7 millimetres) of soil water, avoid tilling soils that are wet to avoid compaction problems.
Yield losses are greatest on clay soils during periods of excess water in July, regardless of crop (Rigaux & Singh, 1977).
Table 3.6 Indicator weeds of soil moisture problems (Organic Gardening Staff, 1978)
| Dry Soils ("M" limitation) | Poorly Drained Soils ("W" limitation) |
Tumble mustard Stinking mayweed Thyme-leaved sandwort Stork's bill Purslane Prostrate pigweed |
Buttercup Field mint Horsetail Silverweed Coltsfoot Bindweed Comfrey St. John's wort Swamp smartweed |
Table 3.7 Cropping and management strategies
| Droughty soils and drier weather conditions | Wet soils and wetter weather conditions | Soils with both moisture (M) and wetness (W) limitations |
|
|
|

