Provincial Respiratory Surveillance Report

COVID-19 and Seasonal Influenza

2024-2025 season

*seasons are defined as June 30, 2024 to June 28, 2025


This weekly report provides a current epidemiological update on the intensity and severity of respiratory activity in Manitoba including laboratory confirmed activity of both COVID-19 and seasonal influenza. Surveillance data include syndromic indicators, laboratory testing, associated hospitalization and mortality, and outbreaks. Updates around immunization coverage in COVID-19 and seasonal influenza are also included.

Data are reported with a one-week delay for increased data accuracy, completeness and reliability. More analyses continue to be conducted and will be added to this report as available. It is published online at approximately 3:00pm every Friday.

Week 36 (September 1 – September 7, 2024)

About epidemiological week

Data extracted up to 1:00 am on September 12, 2024
Next reporting date: September 20, 2024


COVID-19 vaccination / Seasonal Influenza vaccination

COVID-19

Test positivity remains lower than the peak rate observed in the fall (week 45). In the past few weeks there has been signs of an increase; hospital/ICU admissions and fatalities increased this week compared to the previous week, all other indicators remained stable over time.

Wastewater surveillance data up to September 10 indicates high viral activity for COVID-19.

Cases

About cases

  • Cases this week: 136
  • Total cases: 862 (June 30, 2024 – September 7, 2024)
More Analyses

Testing

About testing

This week

  • Average daily specimens: 135
  • Weekly positivity rate: 22.8%

Total (June 30, 2024 – September 7, 2024)

  • Tested people: 6,668
  • Population tested: 0.5%
  • Specimens tested: 8,286
  • Positivity rate: 17.8%
More Analyses

Severity

About associated severity

Severe outcomes this week

  • Hospital admissions: 59
    • ICU admissions3: 10
  • Deaths7: 10

Total severe outcomes (June 30, 2024 – September 7, 2024)

  • Hospital admissions: 373
    • ICU admissions: 39
  • Deaths: Unavailable

Outbreaks

About outbreaks

COVID-19 outbreaks this week

  • In long-term care facilities: 3
  • In hospitals: 0
  • In other settings: 5

Total COVID-19 outbreaks (June 30, 2024 – September 7, 2024)

  • In long-term care facilities: 51
  • In hospitals: 20
  • In other settings: 5
More Analyses

Seasonal Influenza

Test positivity remains lower than the peak rate observed in the fall (week 51); all other indicators remained stable over time.

No RSV detection in week 36. RSV detection decreased slightly compared with the previous week.

Cases

Cases this week

  • Influenza A: 3
  • Influenza B: 0

Total cases (June 30, 2024 – September 7, 2024)

  • Influenza A: 9
  • Influenza B: 0
More Analyses

Testing

Influenza testing this week

  • Average daily specimens: 59
  • Influenza A positivity rate: 0.2%
  • Influenza B positivity rate: 0.0%

Other respiratory pathogens this week

  • RSV4 positivity rate: 0.0%
  • RSV detections: 0
More Analyses

Severity

Severe outcomes this week

  • Hospital admissions: Unavailable
    • ICU admissions: Unavailable
  • Deaths7: 0

Total severe outcomes (June 30, 2024 – September 7, 2024)

  • Hospital admissions: Unavailable
    • ICU admissions: Unavailable
  • Deaths: 0

Outbreaks

About outbreaks

Influenza outbreaks this week

  • Influenza A: 0
  • Influenza B: 0

Total influenza outbreaks (June 30, 2024 – September 7, 2024)

  • Influenza A: 0
  • Influenza B: 0

Other outbreaks

  • This week: 0
  • Total (June 30, 2024 – September 7, 2024): 22
More Analyses

Syndromic Indicators

Weekly respiratory visits to emergency department are currently lower than the peak seen in week 51. In the past fews week there are signs of an increase. All other syndromic indicators have remained similar to the previous week.

FluWatchers

About FluWatchers

Participants reporting this week: 304

Reporting fever and cough: 1.6%

More Analyses

Physician Visits

About sentinel physicians

Influenza Like Illness (ILI) Visits to sentinel physicians this week: 3.3%

More Analyses

Antiviral

About Antiviral

Units of antiviral dispensed from pharmacies this week: 0

More Analyses

ED Visits

About emergency room visits

Respiratory visits to emergency department (ED) this week: 1224

More Analyses

Important Notes

  1. Data about COVID-19 and influenza cases are extracted from PHIMS.
  2. Numbers are subject to change. Missed events in the current report due to reporting delays will be included in later reports when data become available. Cumulative totals include all events from start of the current season to end of the reporting week.
  3. ICU admissions are included in hospital admissions, and include adult and pediatric cases.
  4. RSV - Respiratory syncytial virus.
  5. Influenza associated hospitalizations and associated ICU cases are currently under review.
  6. COVID case counts are under review and maybe an undercount.
  7. Deaths are reported as “associated with” COVID or Influenza, but not all have been “caused by” COVID or Influenza. “COVID associated deaths” and “Influenza associated deaths” include persons who had a confirmed positive lab test result for COVID or Influenza, within 30 days before their death, or following their death through a post mortem. The number of deaths from week to week may be impacted by the lag-time for entry of deaths from Vital Statistics/Client Registry/clinical notifications and delayed entry of cases.

COVID-19

Cases

Figure 1. Weekly Cases of COVID-19 by Season, Manitoba, 2021 – 2025 (June through June)

Back


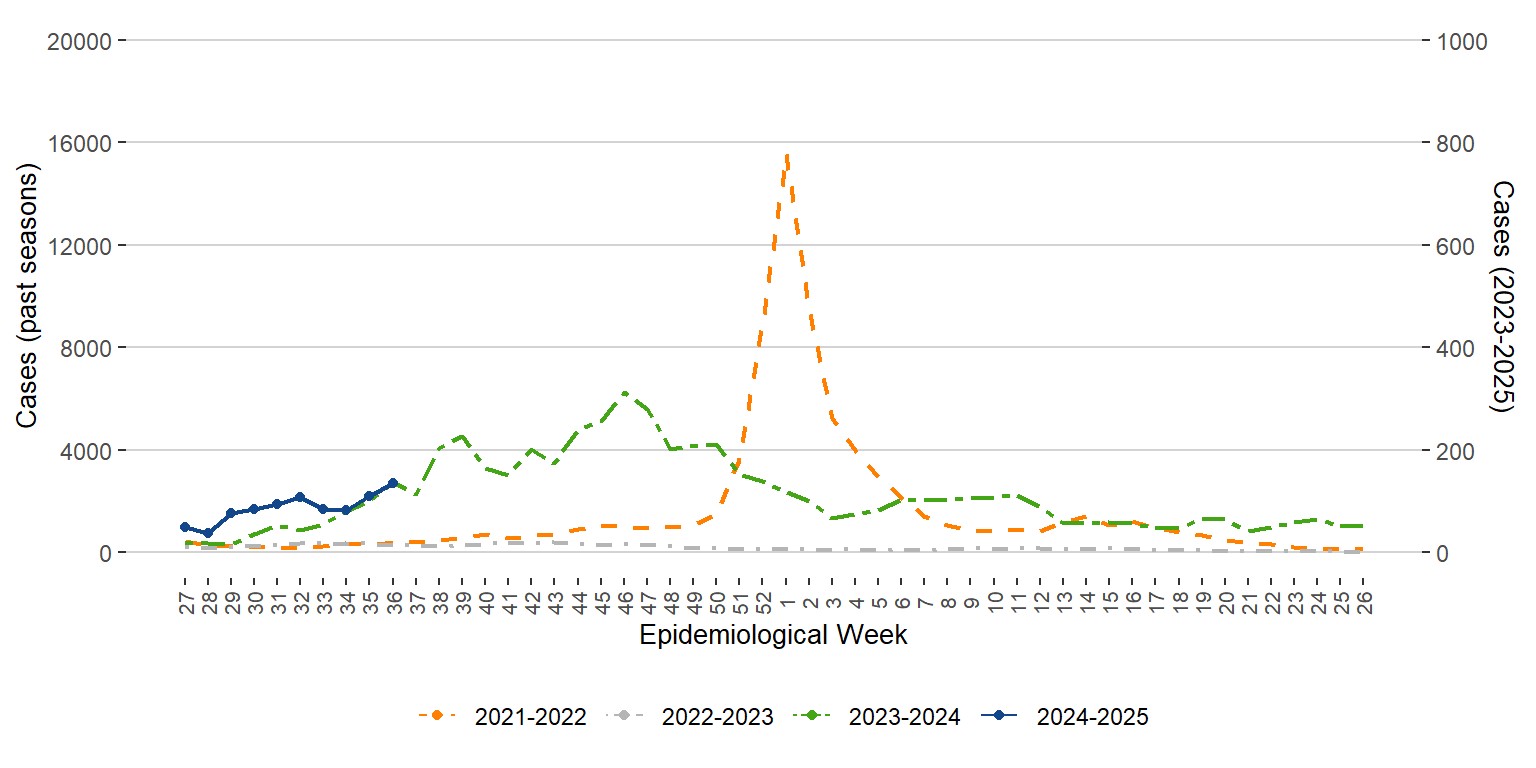
Figure 2. Sex and Age Distribution of COVID-19 Cases, Manitoba, June 30, 2024 – September 7, 2024

Back


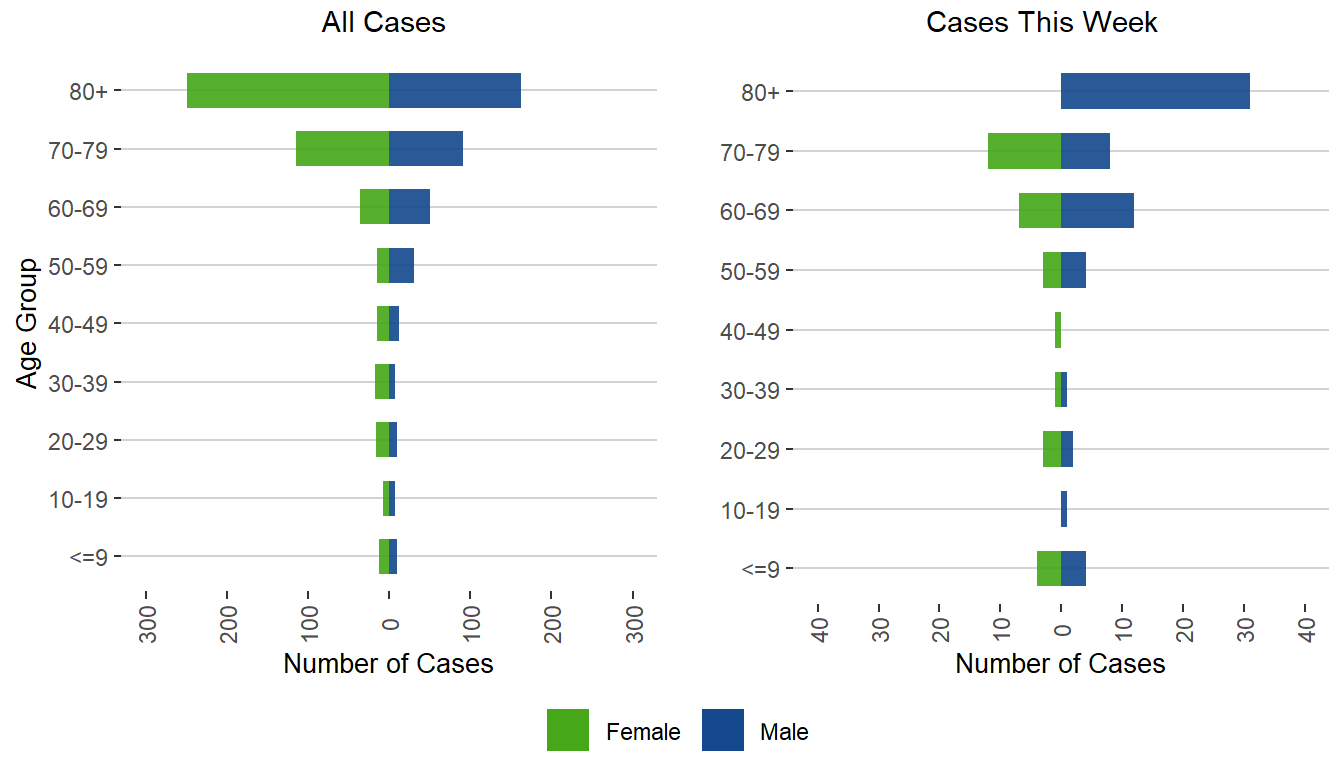
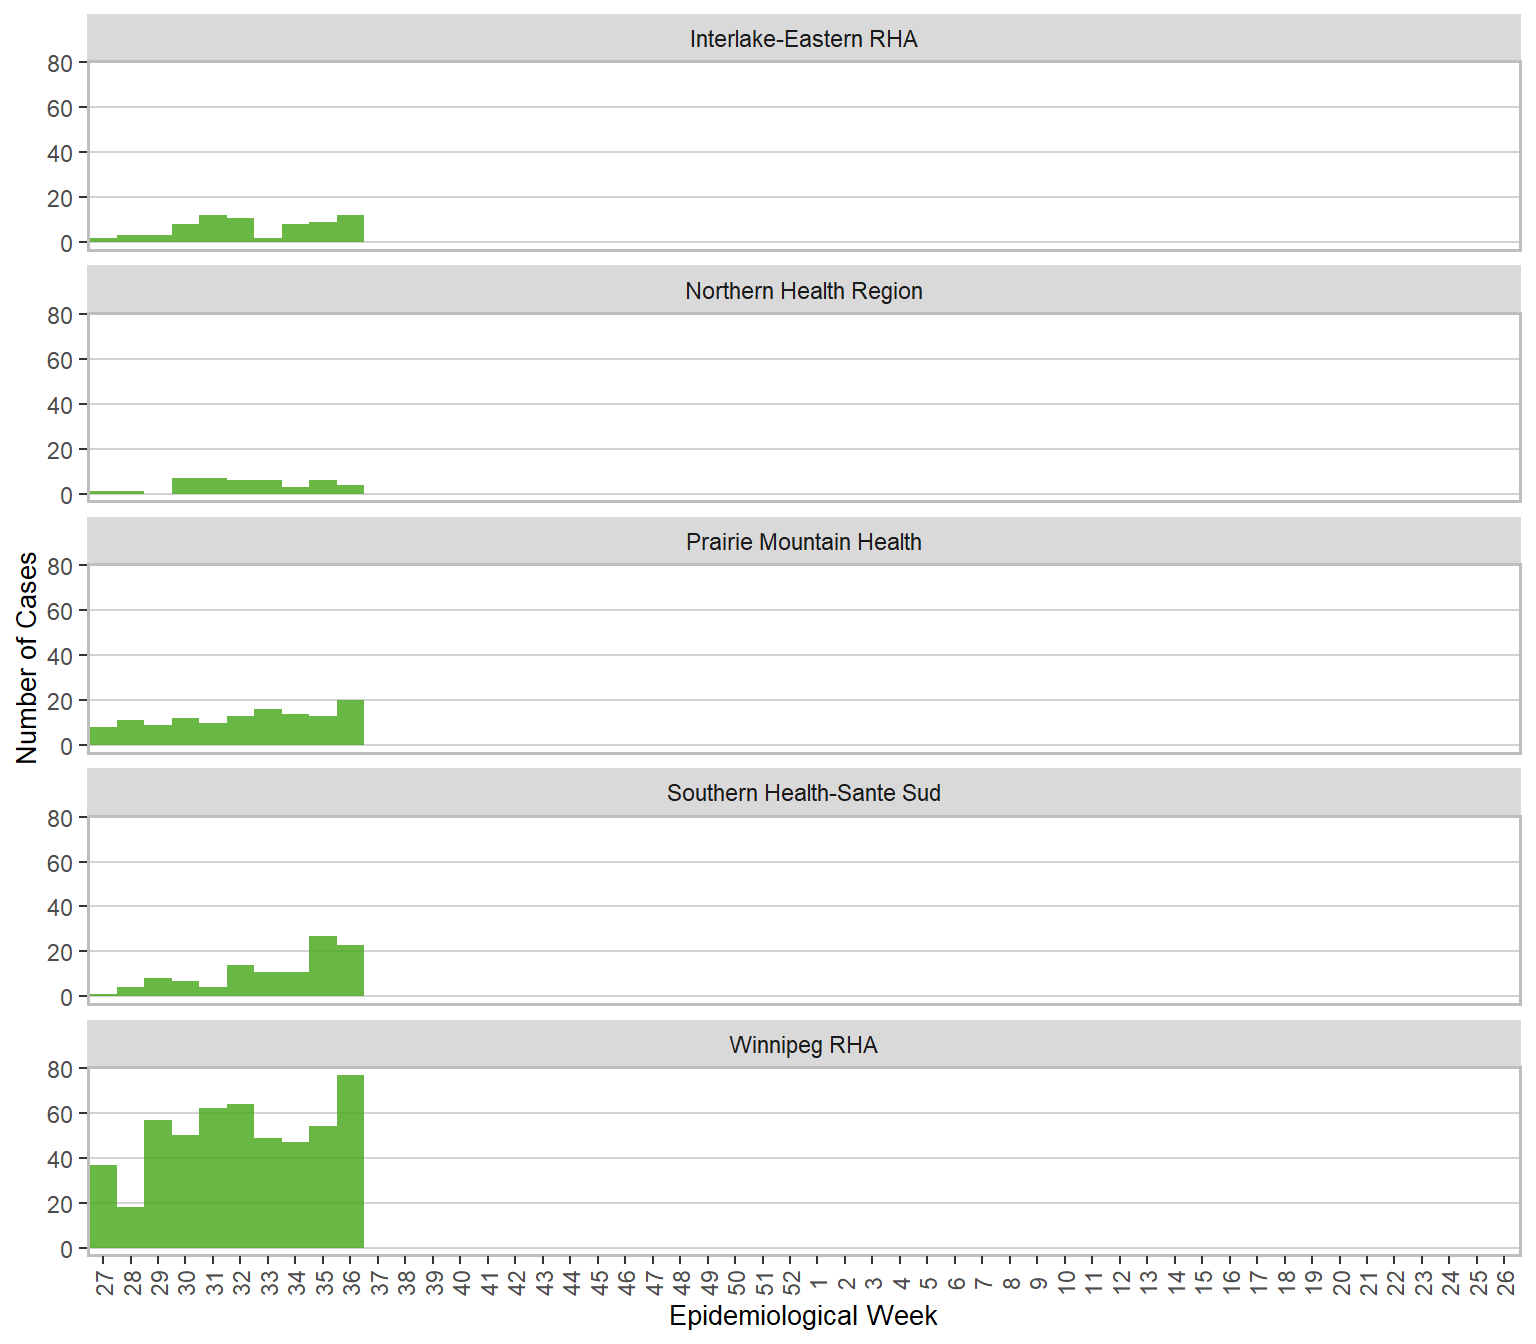
Figure 3. Cases of COVID-19 by Health Region and Public Health Report Date, Manitoba, June 30, 2024 – September 7, 2024

Back


Testing

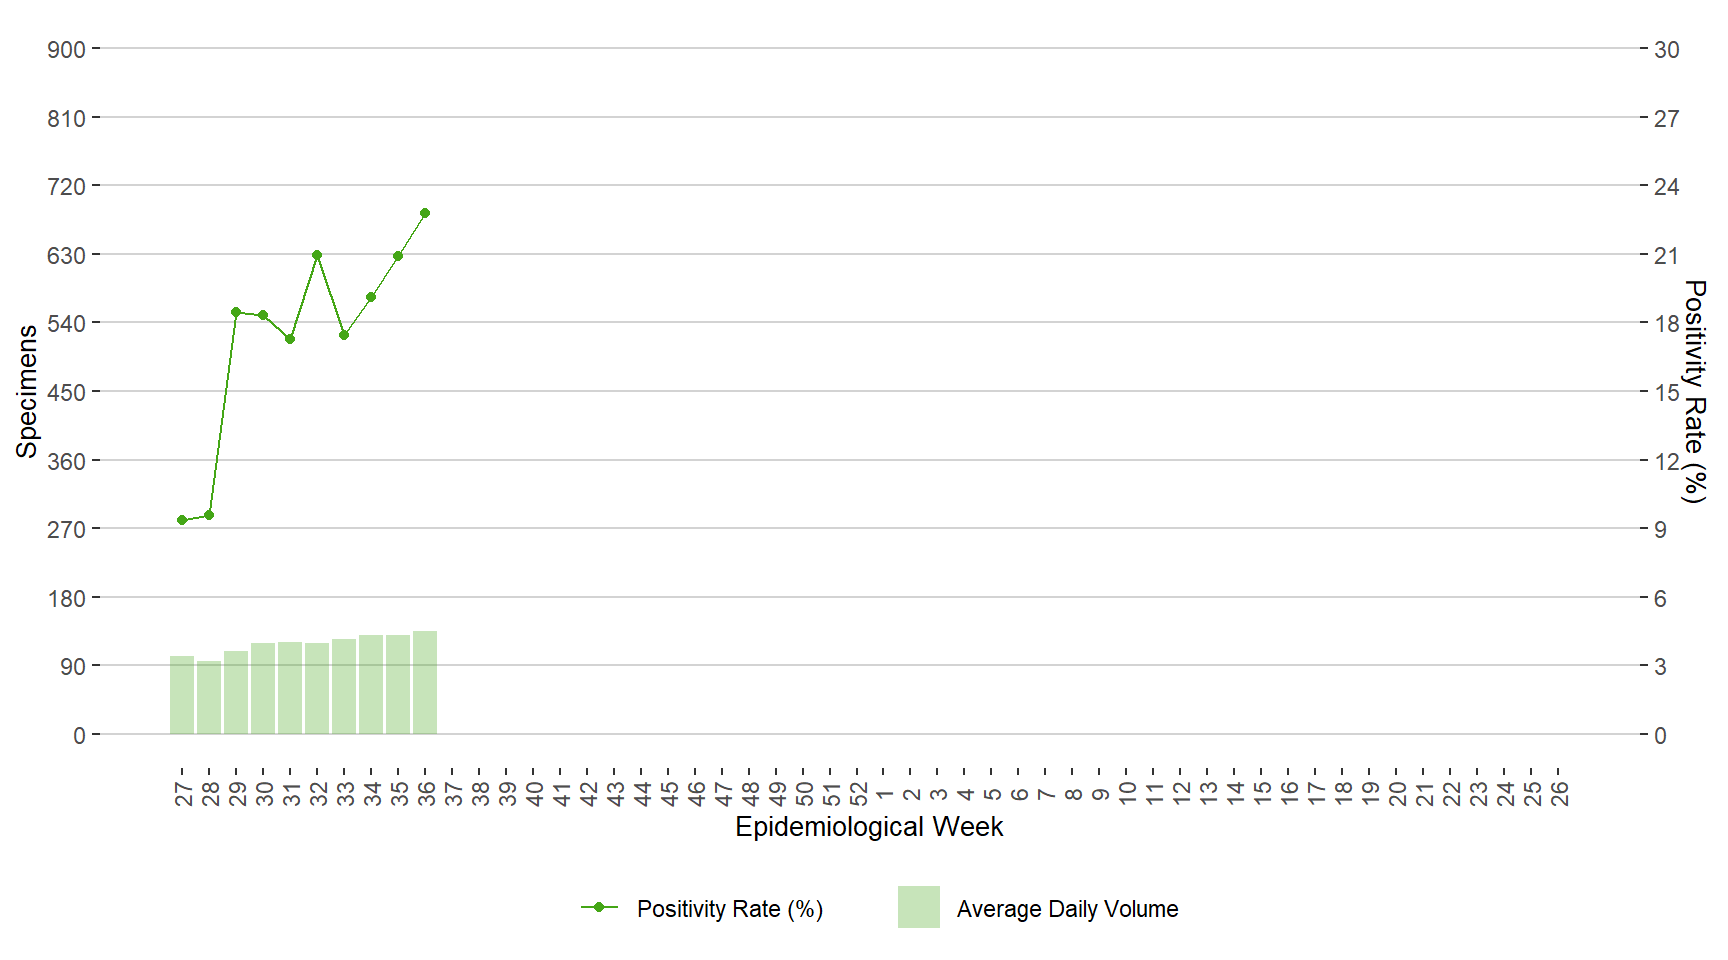
Figure 4. Average Daily Testing Volume and Positivity (%) for COVID-19 by Week of Specimen Receiving Date, Manitoba, June 30, 2024 – September 7, 2024

Back


Vaccination

Table 1. Fall COVID-19 Campaign Coverage (at least 1 dose) and Coverage in the Last Six Months by Age Group

Sep 1, 2022 - Feb 28, 2023
Sep 1, 2023 - Sep 07, 2024
( Last 6 months, up to Sep 07, 2024 )
Age group Number Vaccinated %Coverage Number Vaccinated %Coverage Number Vaccinated %Coverage
00-04 4951 5.9% 4159 4.9% 445 0.5%
05-17 23501 10.1% 15530 6.7% 468 0.2%
18-49 77870 12.8% 53838 8.9% 1429 0.2%
50-64 74119 28.5% 61420 23.6% 2038 0.8%
65+ 151317 62.2% 140160 57.6% 16057 6.6%
All 357089 25.0% 291025 20.4% 20573 1.4%

About vaccination coverage

Back

Seasonal Influenza

Cases

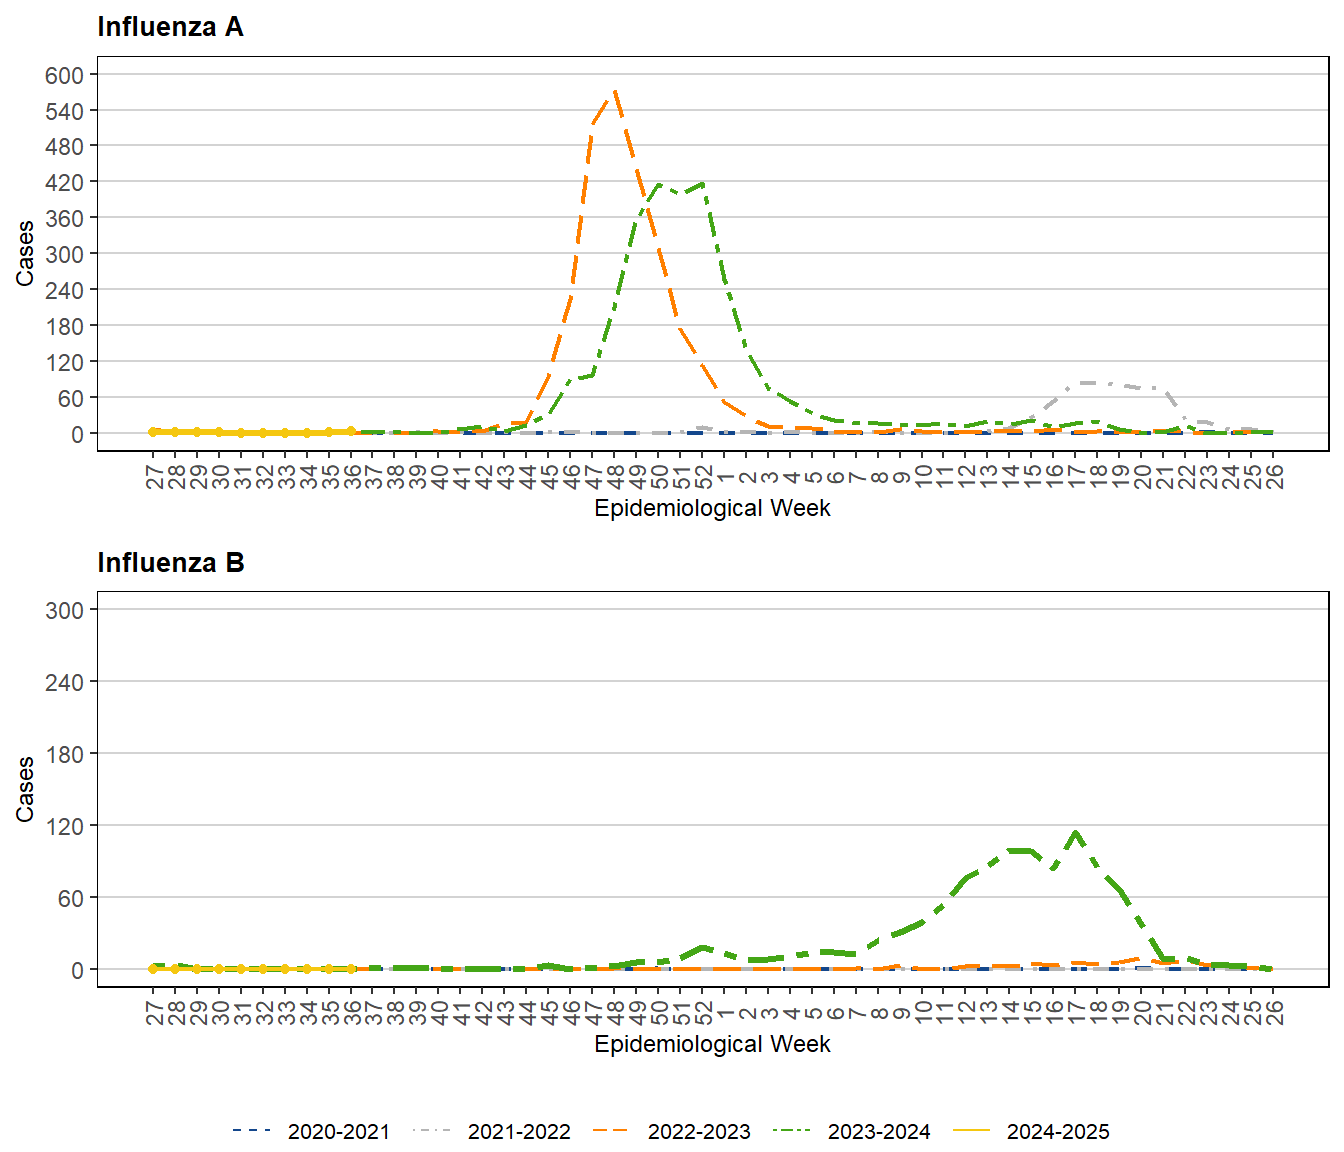
Figure 5. Weekly Cases of Influenza by Season, Manitoba, 2020 – 2025 (June through June)

Back


Testing

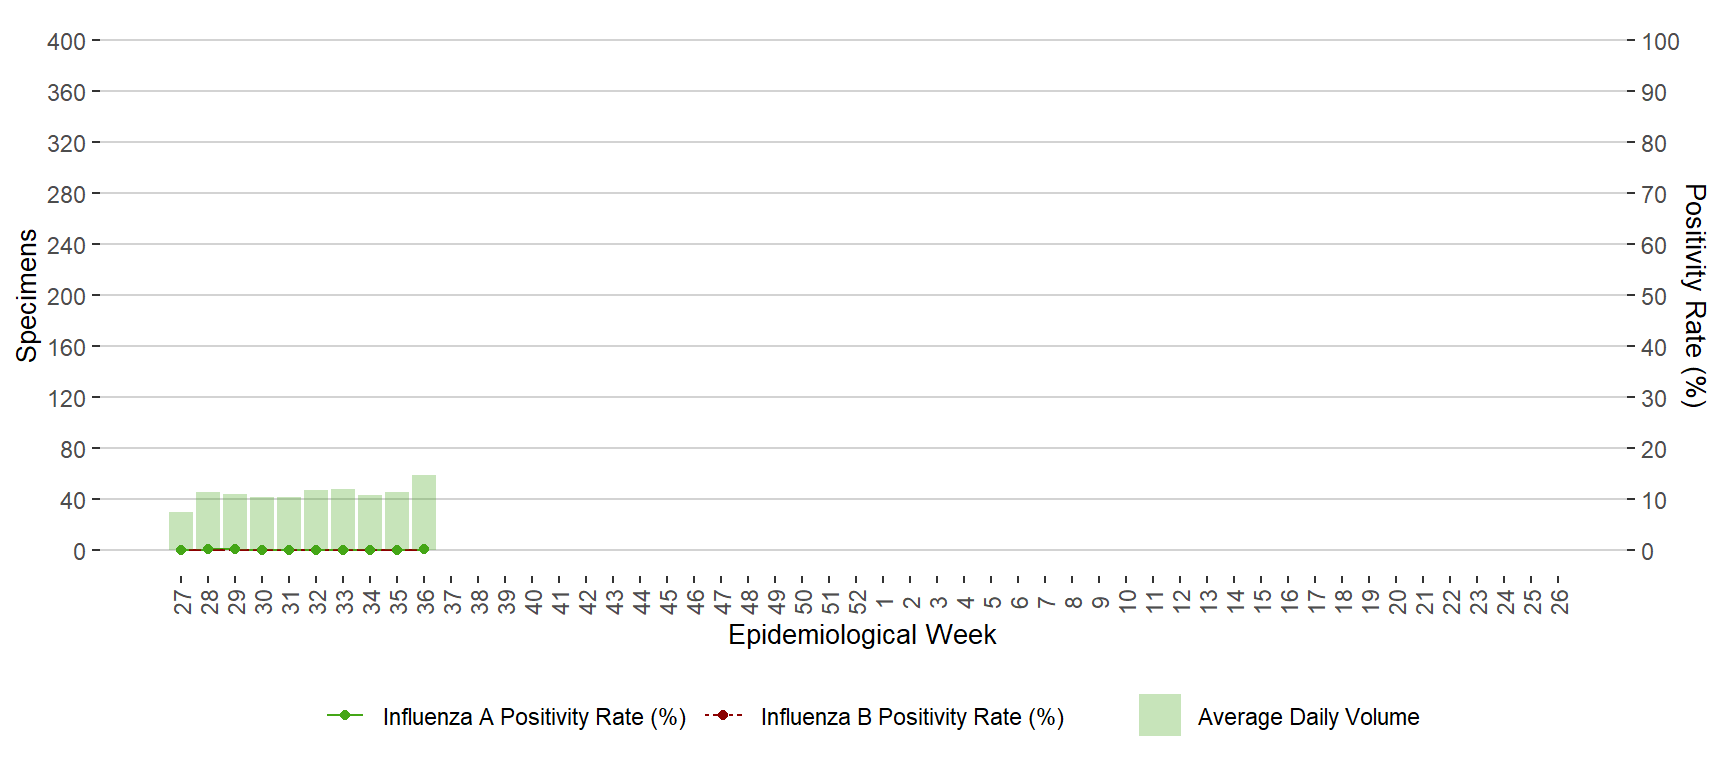
Figure 6. Average Daily Testing Volume and Positivity (%) for Influenza by Week of Specimen Receiving Date, Manitoba, June 30, 2024 – September 7, 2024

Back


Figure 7. Number of Positive Respiratory Virus Tests by Week of Specimen Receiving Date, Manitoba, June 30, 2024 – September 7, 2024

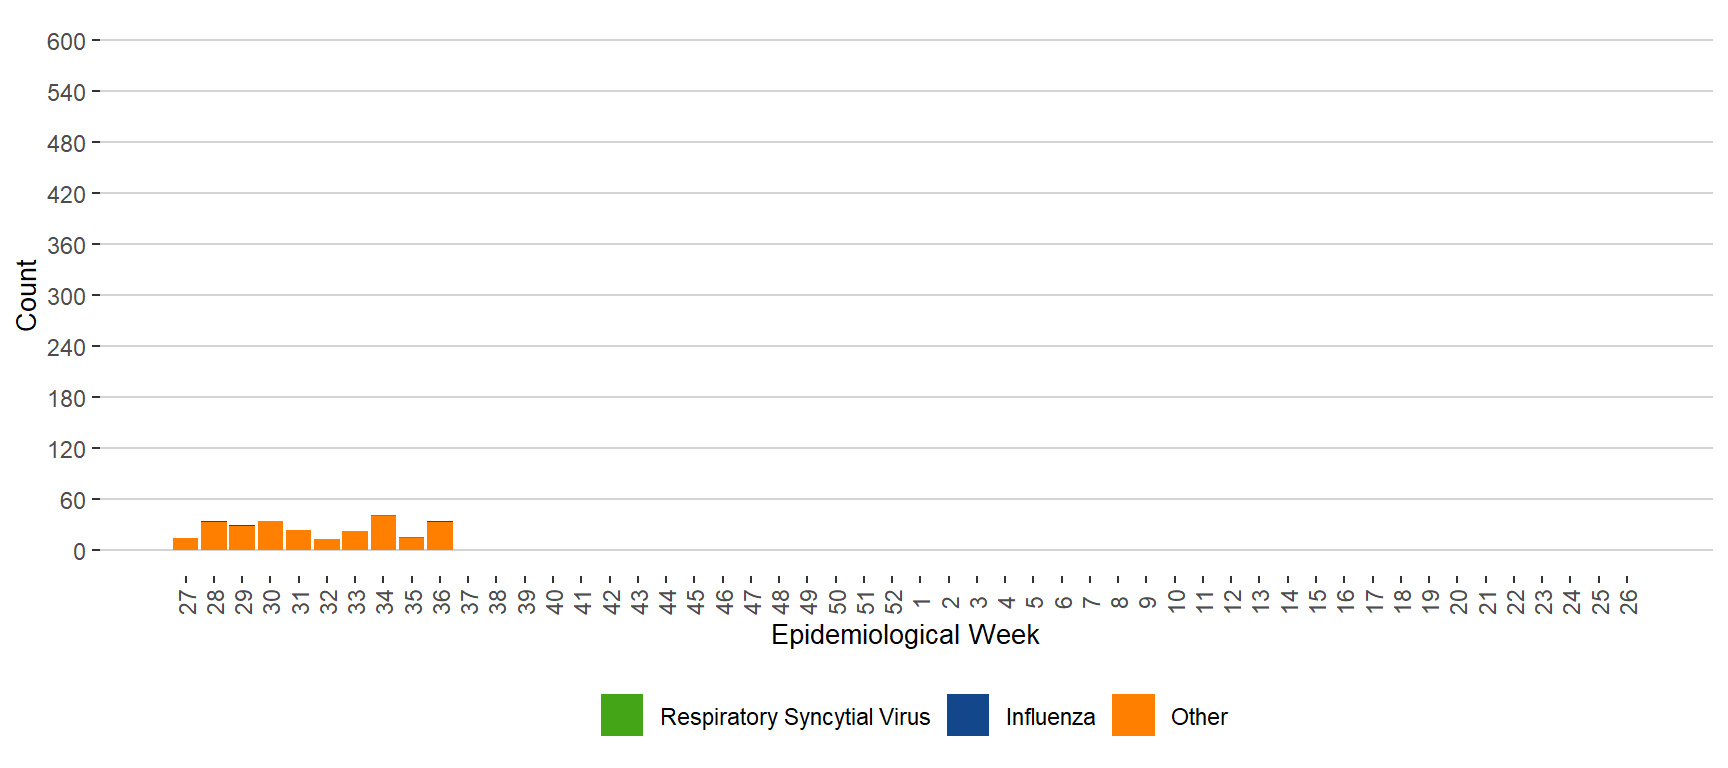
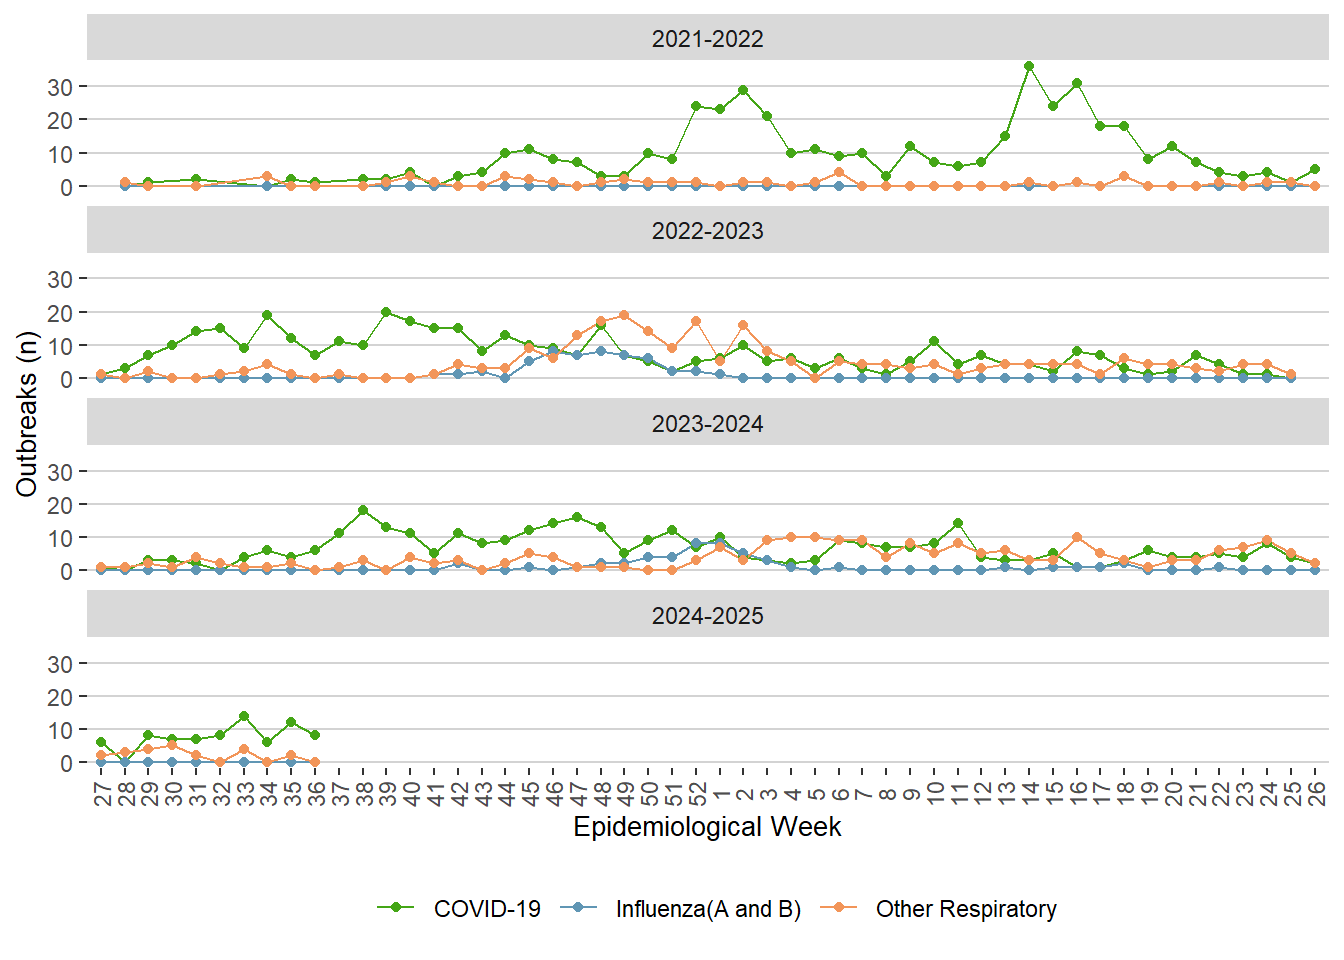
Note. Other respiratory viruses include adenovirus, enterovirus/rhinovirus, human coronavirus (seasonal), human metapneumovirus and human parainfluenza virus.

Back


Outbreaks

Figure 8. Weekly Respiratory Outbreaks, Manitoba, 2021 – September 7, 2024

Back


Vaccinations

Table 2. Coverage of Influenza Vaccinations, Manitoba

Sep 1, 2022 - May 31, 2023
Sep 1, 2023 - Sep 07, 2024
Age group Number Vaccinated %Coverage Number Vaccinated %Coverage
0-4 17512 20.9% 14667 17.5%
5-17 37352 15.7% 32033 13.4%
18-49 95919 15.4% 90194 14.5%
50-64 83203 32.3% 78529 30.4%
65+ 146413 58.9% 148776 59.9%
All 386652 26.7% 368948 25.4%

Note. Actual number of people vaccinated between September 1 and September 7, 2024 may be higher due to delays in reporting doses administered.

About vaccination coverage

Back


FluWatchers

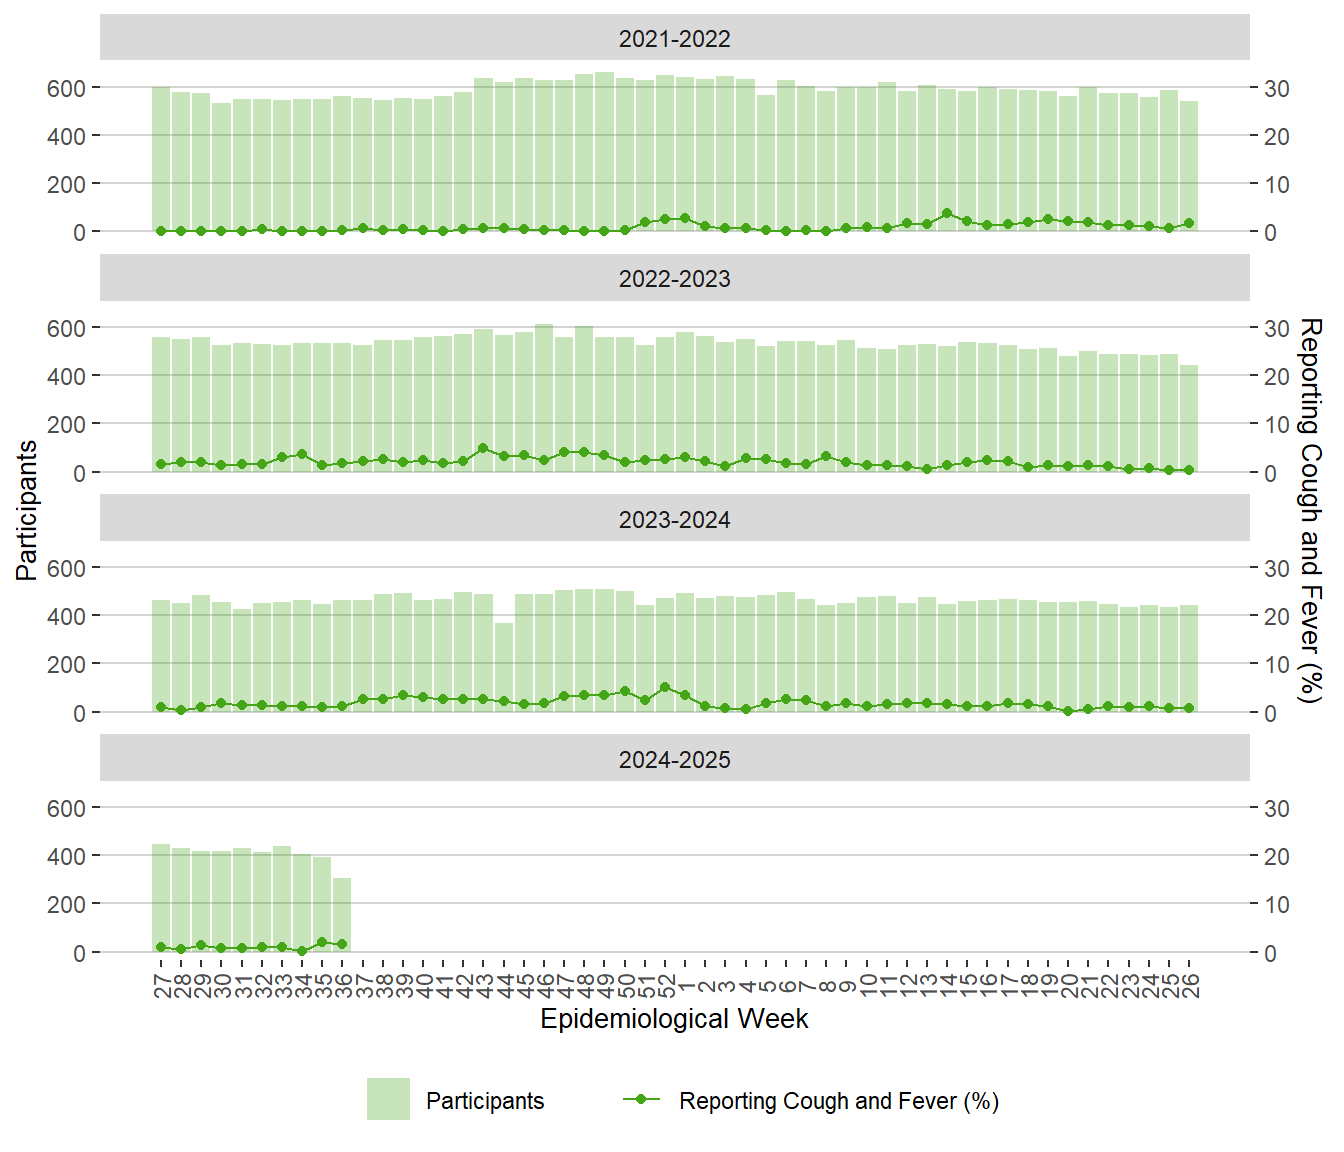
Figure 9. Weekly FluWatchers Participants and Percentage Reporting Fever and Cough, Manitoba, 2020 – September 7, 2024

Back


Physician Visits

Figure 10. Weekly Percentage of ILI Related Visits to Sentinel Physicians, Manitoba, 2018 – September 7, 2024

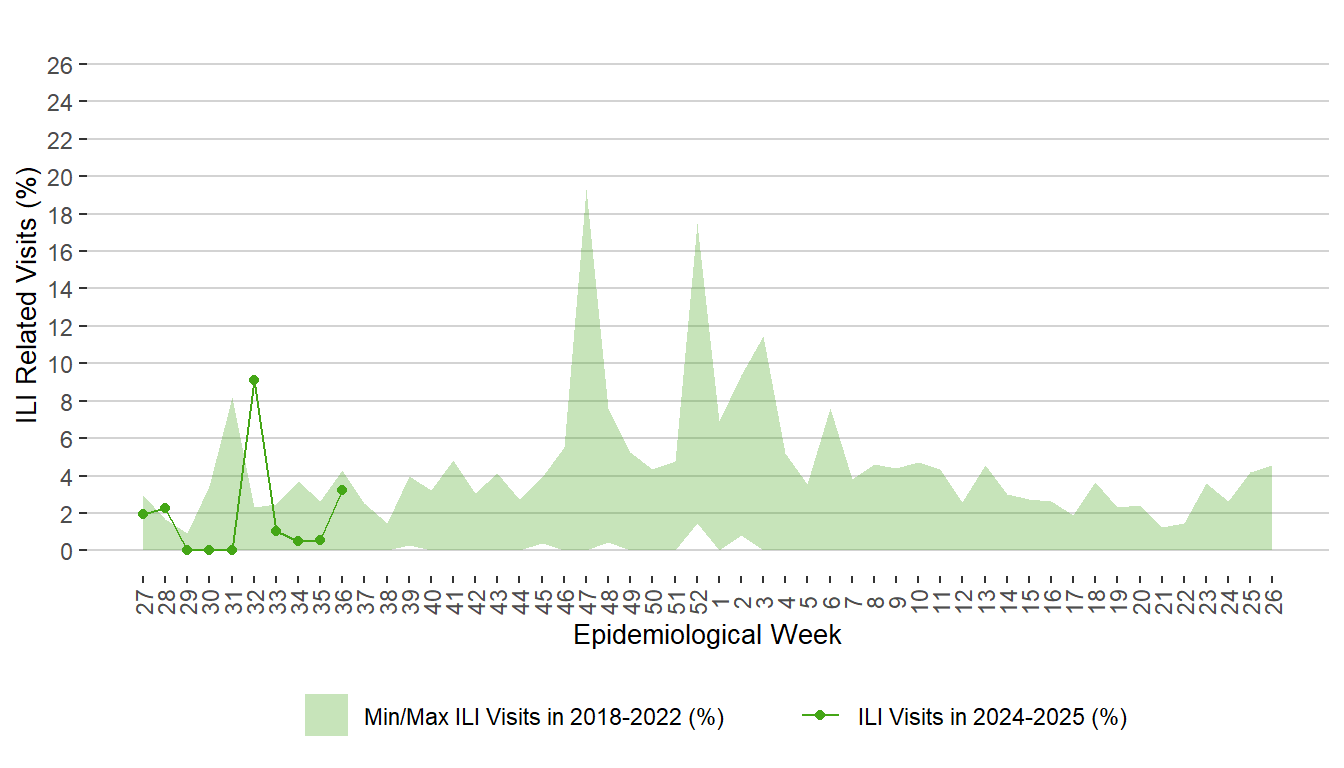
Note. Due to small numbers the rates should be interpreted with caution.

Back


Antiviral

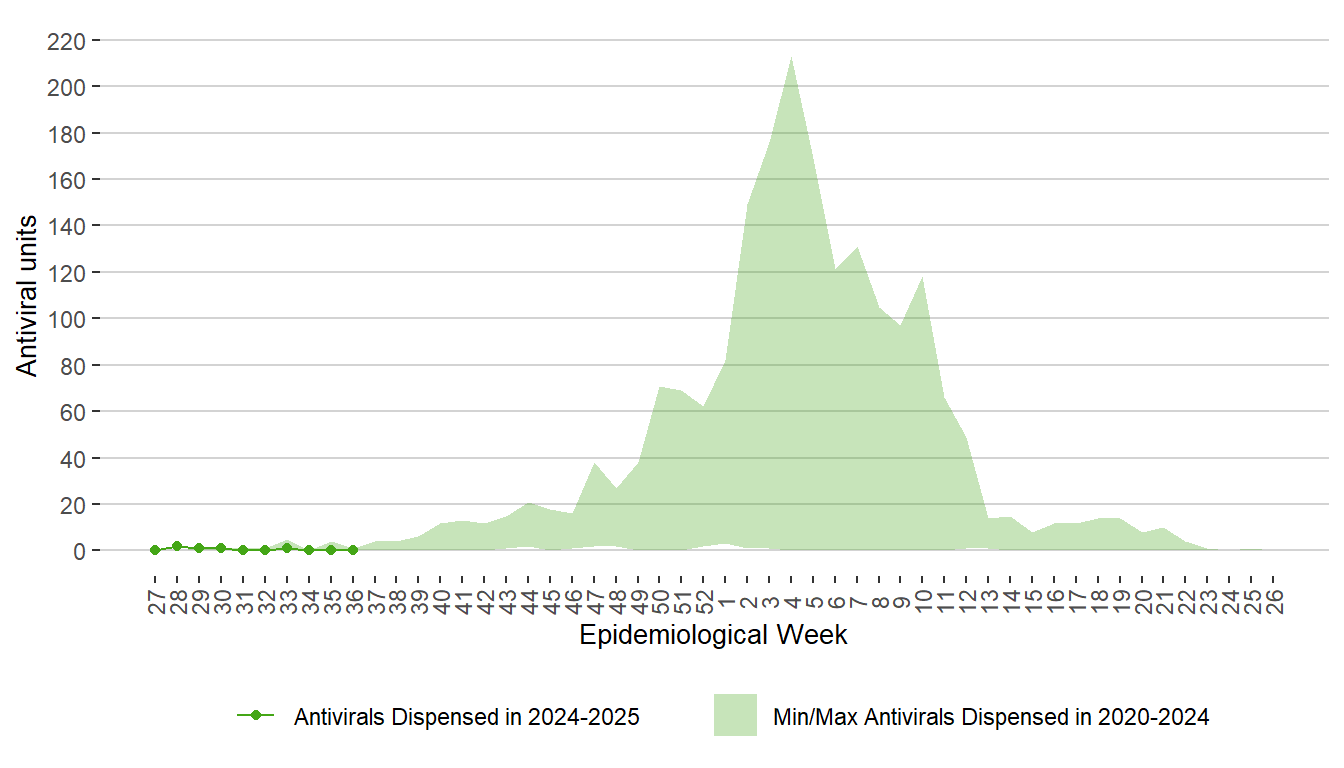
Figure 11. Weekly Units of Antiviral Dispensed from Pharmacies, Manitoba, 2020 – September 7, 2024

Back


ED Visits

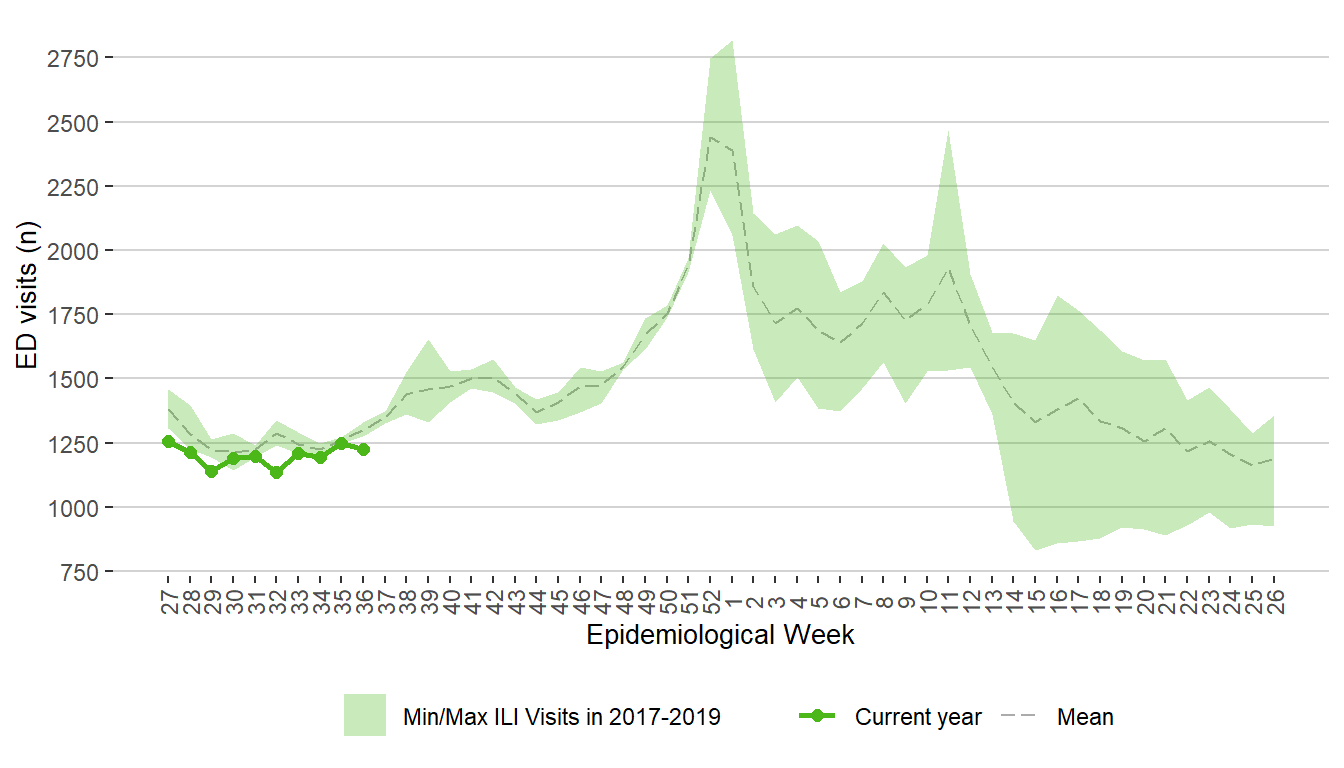
Figure 12. Weekly Respiratory Visits to Emergency Department, Manitoba, 2017 – September 7, 2024

Back